| |
- Damping curve. (part 1)
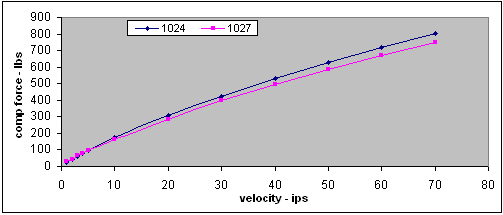
- A damping curve can be viewed by plotting the force and velocity on a graph.
- Here's a graph that shows the two stacks we've been looking at.
- The blue line shows the damping curve of the stock stack, #1024.
- The pink line shows the curve of mod stack with the 2 shims removed, #1027.
- The forces are similar from 1 - 5ips, then the mod stack starts to get softer.
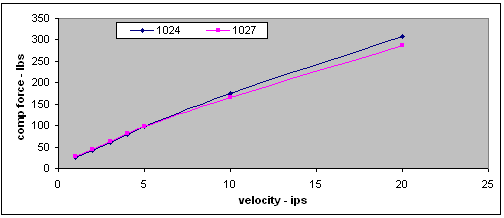
- It's easier to see what's happening at the lower velocities of we crop the graph. Here is a graph that only shows 0 - 20 ips.
- The graphs give you a quick overview of how the two stacks compare.
- But you can't see the exact numbers or the percentage changes looking at the graph. Therefore, we prefer looking at the numbers and then visualizing the graph.
|
|
|
| |
|
 |
 |