Fork: brief explaination of pressure graphs
- - - - - - - - - - - - -
Here is a brief expaination of the pressure graphs.
- We will use tests 1480f and 1482f for these examples.
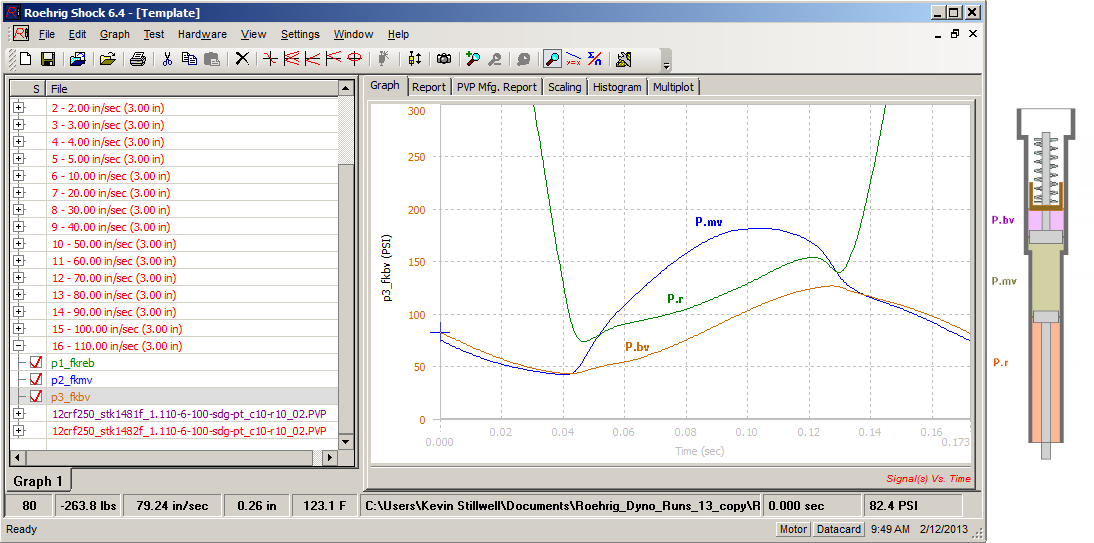
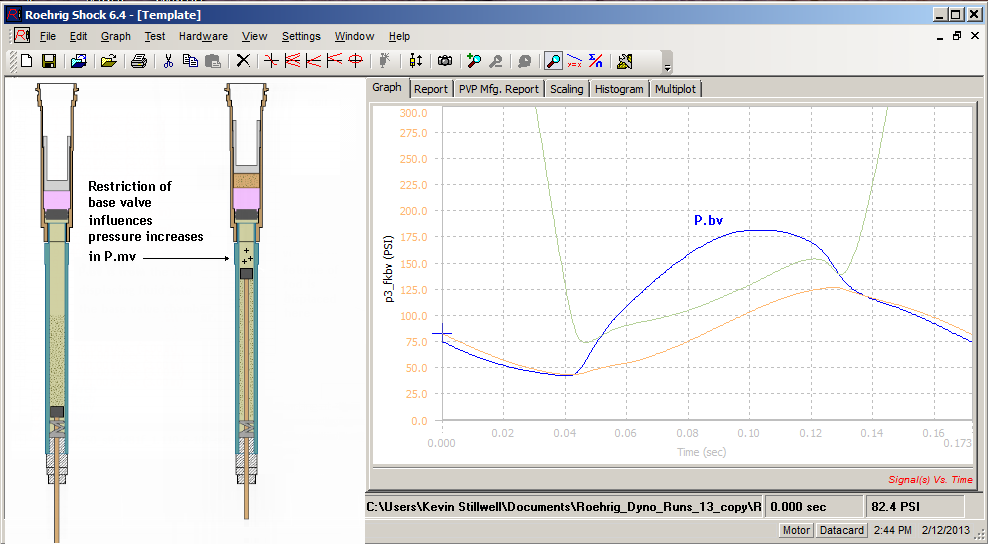
This first graph shows the three pressure lines.
1. green line = P.r (pressure in the rebound chamber)
2. blue line = P.mv (pressure in the mid valve chamber)
3. gold line = P.bv (pressure in the base valve chamber)
- - - - - - - - - - - - -
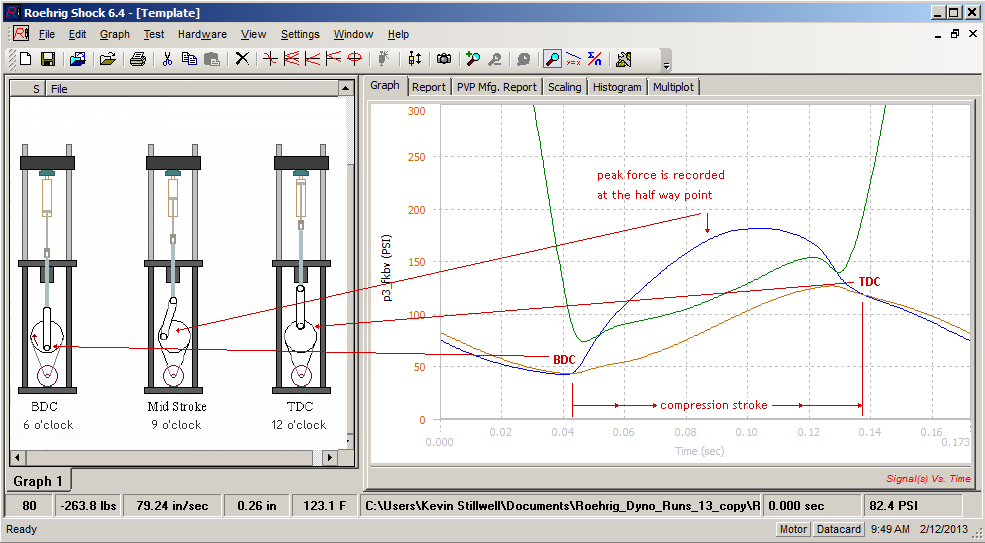
The focus is on the compression stroke.
1. The dyno test we perform is called a 'peak velocity pickoff'. This simply means the fork is stroked a specific velocity and the software picks the compression number at the peak/highest velocity. The peak velicity is always at the mid point of the stroke, or 9 o'clock (velocities up to that point are accelerating, and velocities after that point are decelerating).
- Notice the start and end of the compression stroke on the graph.
- - - - - - - - - - - - -
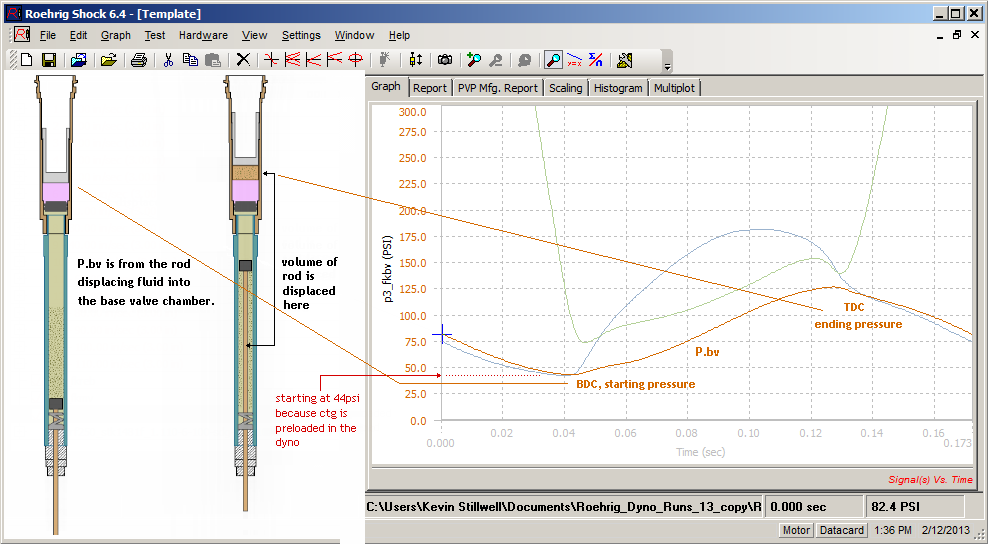
Here is a breakdown of how the pressure graph lines are created. We will start with the most constistant pressure.
1. P.bv, the pressure in the base valve chamber is from the rod displacing fluid into the base valve chamber. This pressure is controlled by the icspring rate. A softer spring produces lower pressures, and a stiffer spring produces higher pressures. If you do not change the icspring or the rod diameter, this pressure will always be the same.
- NOTE, we should say 'this pressure will always be close to the same'. As we mentioned elsewhere, it is hard to consistantly burp the fork and end up with the exact same pressure every time. In this respect, it is not uncommon for this pressure to vary by +/- 1psi. We are anlayzing the mv and bv forces with the pressure and drag removed. Therefore this inconsistancy has no affect on our analysis.
- - - - - - - - - - - - -
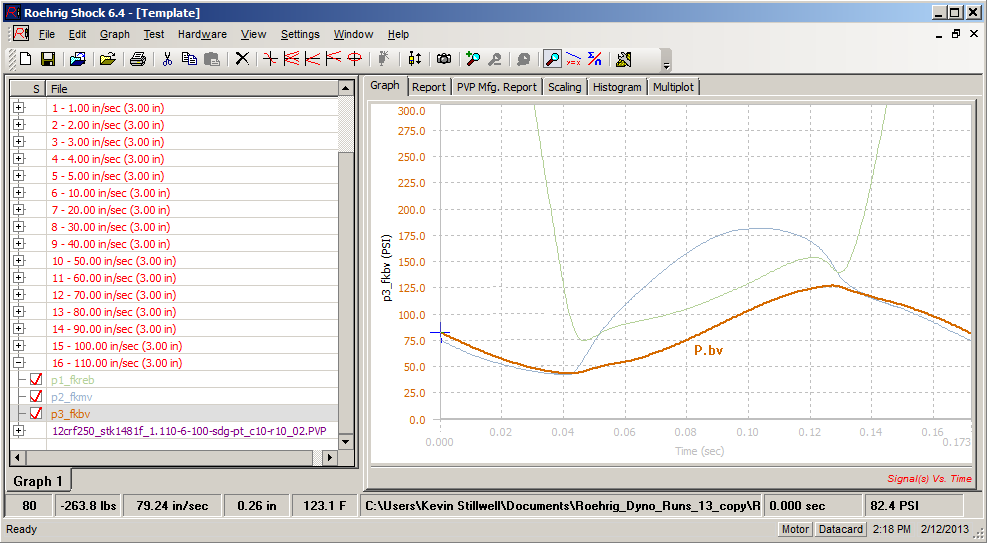
Here's a picture of the P.bv graph line without all the extras.
1. As we stated, this graph line is always shaped the same, and shim changes to the base valve or mid valve do not affect this pressure or change the graph line.
- - - - - - - - - - - - -
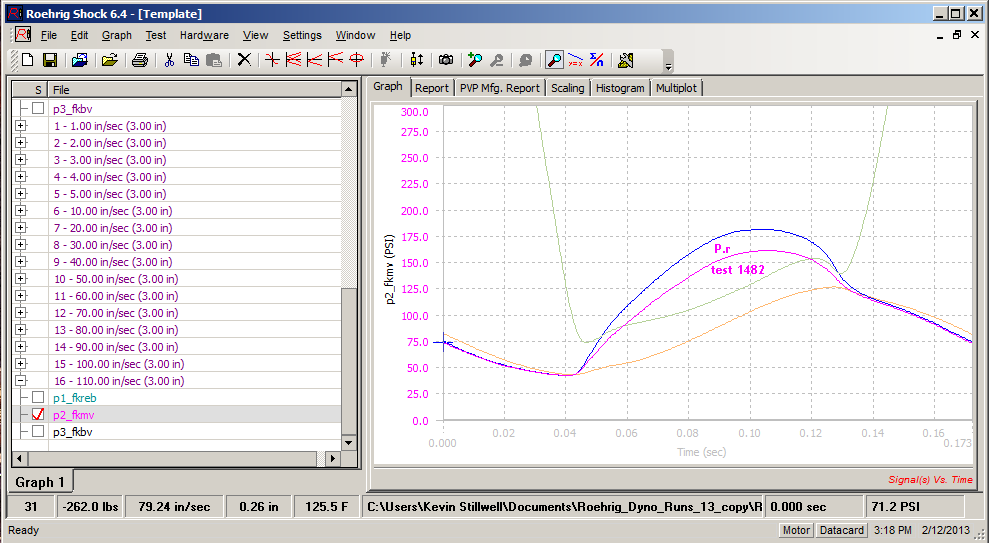
The second most consistant looking pressure graph line is P.mv.
1. The pressure in the mid valve chamber is from the rod going into the cartridge body AND from restriction of the base valve. As the rod enters the cartridge body, the pressures rise. P.mv has a higher pressure and P.bv has a lower pressure, resulting in a pressure difference. The pressures equalize by flowing through the base valve stack.
- This graph line will basically keep it's shape. Adding or removing shims will stiffen or soften the stack, moving the graph line up or down on the scale. But it will keeps it's basic shape.
- - - - - - - - - - - - -
The next graph shows P.mv for test 1482f.
1. Test 1482 has the lighter two stage base valve stack. This softer stack will decrease pressure in P.mv.
- You can see the pink graph line keeps it's basic shape, but it has moved down the scale because the pressures are less.
- - - - - - - - - - - - -
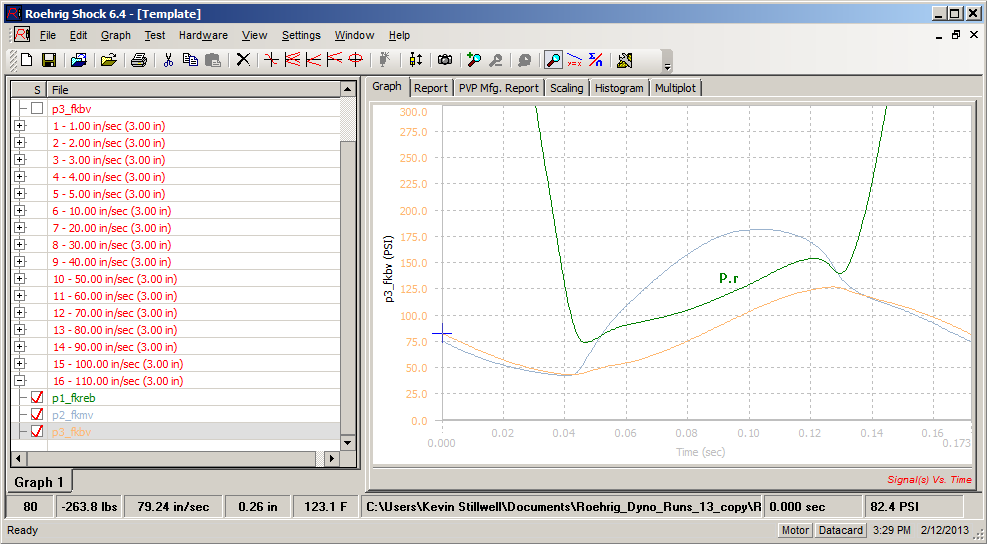
P.r is the most interesting. This graph line can take many shapes, and it's the relationship between P.r and P.bv that gives us some control over cavitation and foaming of the fluids.
1. There is no need to go into extensive detail on P.r at this time. We will do that as we go. For now, we want to show the basic shapes of the graphs so they will have meaning.
- - - - - - - - - - - - -
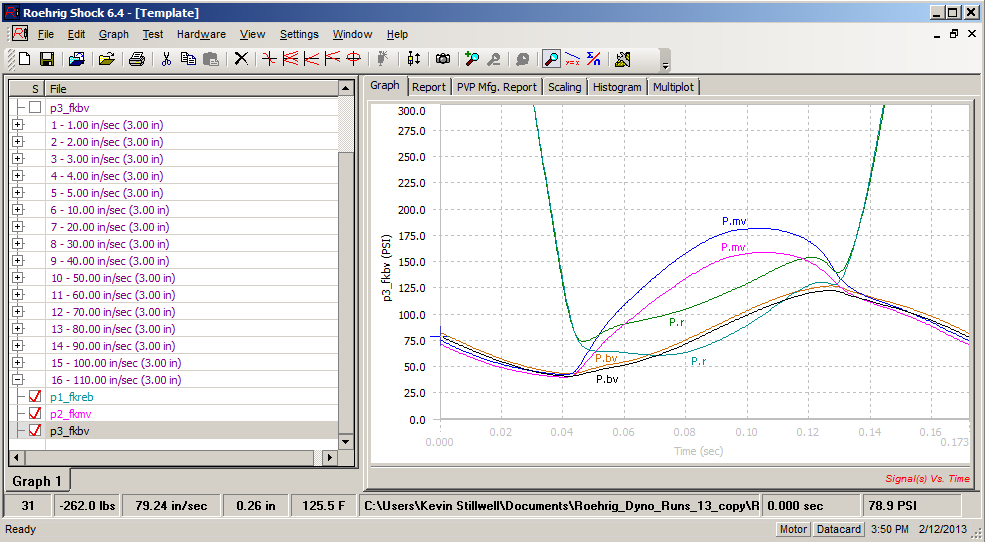
One last graph. Lets compare 1481f and 1482f.
1. 1481f = stock valving for 2010 CRF 250. . . . blue, green, gold graph lines
2. 1482f = softer two stage mid valve stack for 2012 CRF 250. . . . pink, turquoise, black graph lines
A. P.bv is basically the same, as it should be.
B. P.mv has held it's shape, but has moved down on the scale because the pressures are less.
C. P.r has changed. Because P.mv is less, P.r is also less. Now it extends below P.bv, indicating that the fork could cavitate/foam easier.
- - - - - - - - - - - - -
Conclusion for a brief explaination of pressure graphs.
---